-
dima
-
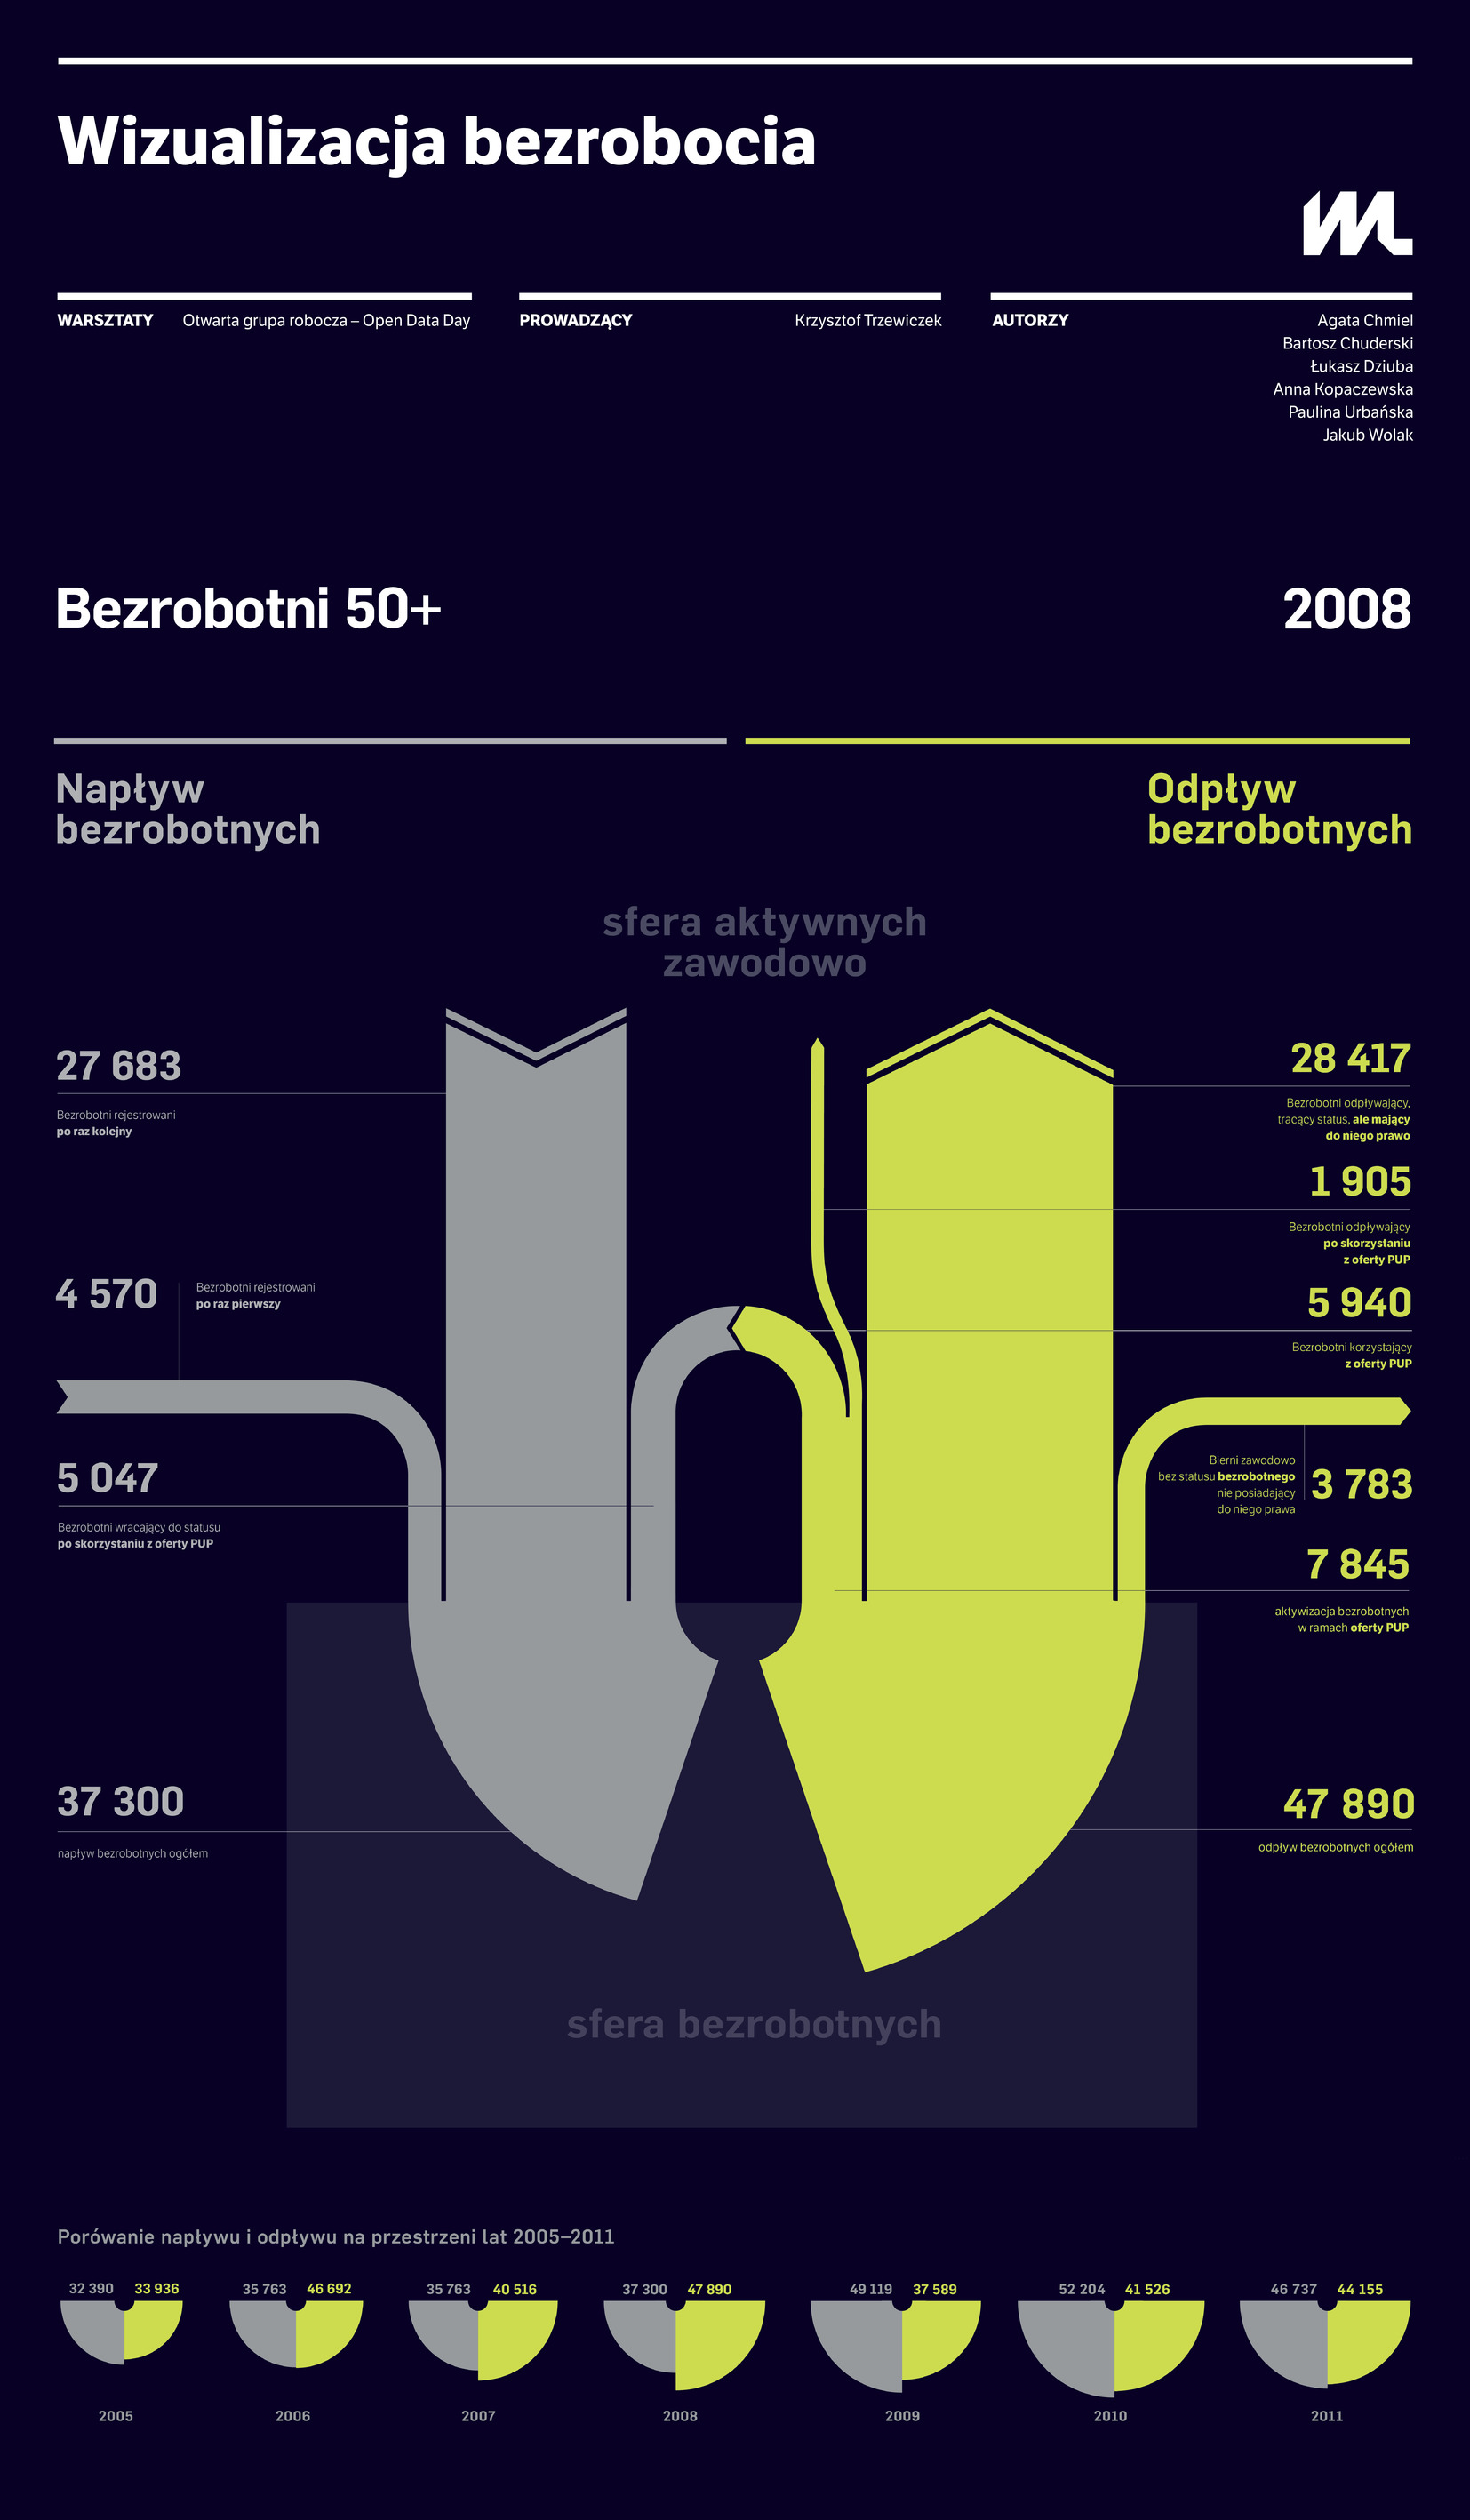
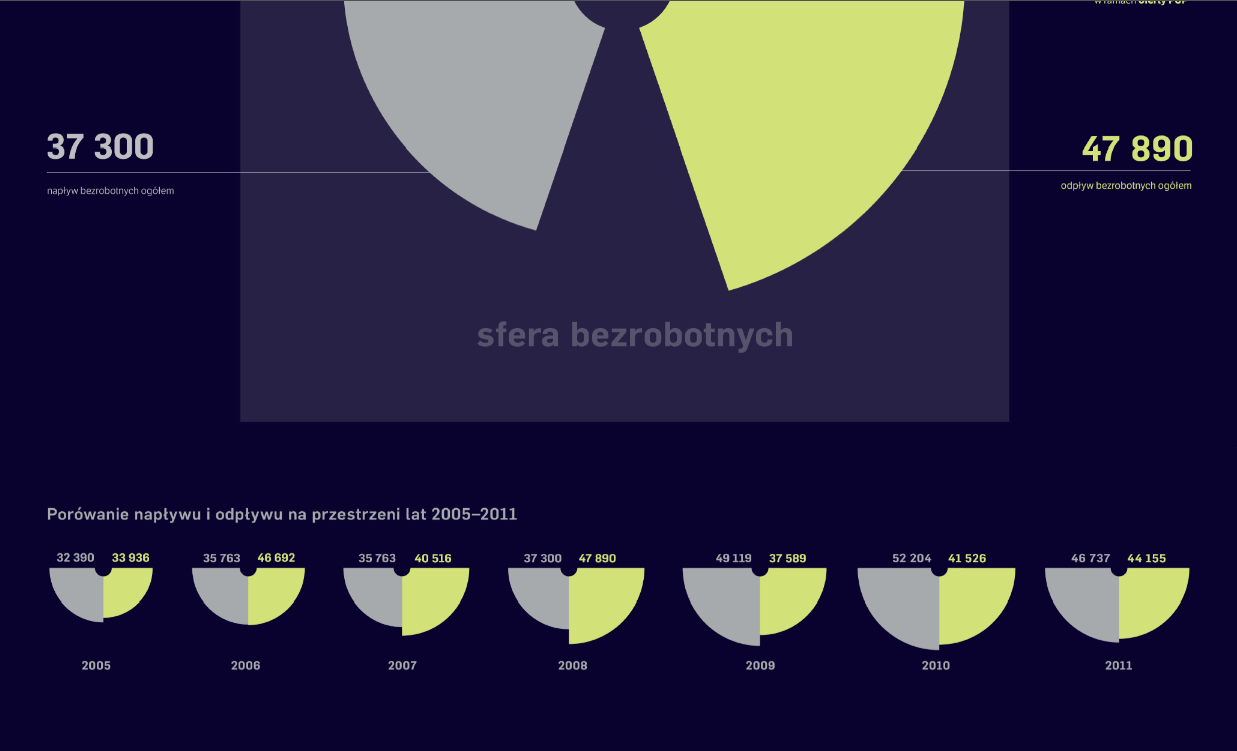
» Unemployment Visualized
Unemployment is a most closely tracked aspect of socio-economic life. The unemployment rate, GDP growth and inflation are the three key parameters to evaluate the condition of any economy. The general nature of these metrics means that they lend themselves well to comparative studies taking into account different countries, periods, age groups, etc. Such generalisations, however, are not free from drawbacks. Without further analysis, it is impossible to get an insight into the processes underlying the surface image of the phenomenon at hand. It is difficult to get satisfactory answers to many questions: What percentage of the overall number of unemployed have registered for the first time? How many people voluntarily give up their unemployed status? What year has seen most people registering as unemployed? Using data on the inflow sources and outflow directions of unemployed people, a new type of graph was created, which aims to provide answers to such questions in a clear manner. Perhaps it will lead to a better understanding of the processes associated with unemployment.
Medialab Katowice
a brief roundup of 2013